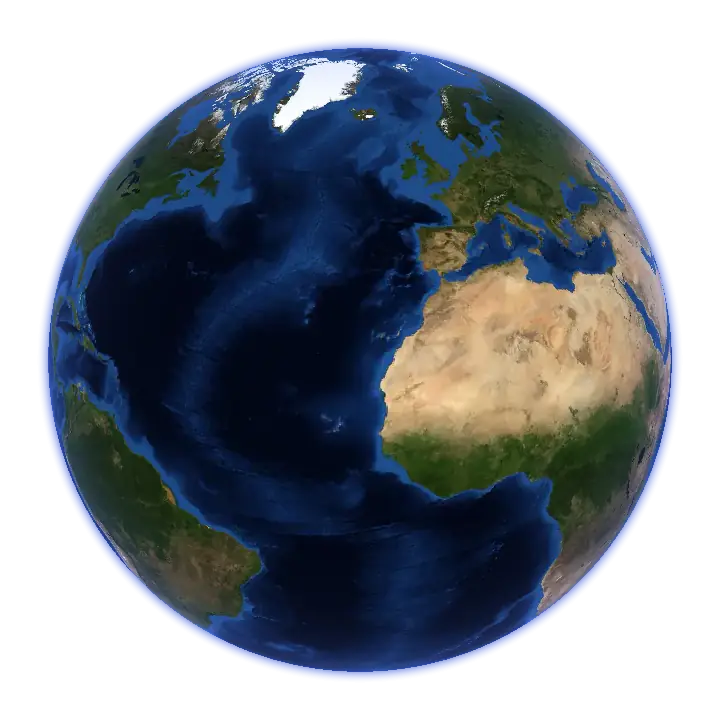
This globe shows the sky, not your flight: the Jetbrief turbulence forecast and the wind at three cruising heights, about 30,000, 34,000 and 38,000 feet, plus forecast cloud cover in low, middle and high layers. The forecast reaches up to 72 hours (three days) from its weather-model run; the time slider shows the hours available now. Click any point to read its wind and turbulence. Every layer says when it is valid and where it comes from.
How to read it
- Turbulence. Peach marks patches where bumps are possible, coral where they are likely. Calm air has no colour, and hatching means no forecast. The colours are chances of meeting turbulence, not how strong it would be, and not a safety rating.
- Wind. The flowing lines show where the air moves and how fast; brighter is faster. The bright fast bands are the jet streams; many clear-air bumps form along their edges, where the wind changes quickly.
- Clouds. Cloud cover from the weather model, in low, middle and high layers. It is a forecast, not a satellite photo.
- Night. The night side and the city lights are drawn for the time you choose.
- Altitude and time. Switch between 30,000, 34,000 and 38,000 ft (flight levels 300, 340 and 380, as pilots say), and move through the available forecast hours with the time slider.
Where the layers come from
| Layer | Source | Detail |
|---|---|---|
| Turbulence | the Jetbrief forecast, from ECMWF and NOAA GFS, calibrated on pilot reports | points about 55 km apart, every 3 hours, up to 72 hours after the model run |
| Wind and clouds | the newest run of ECMWF open data or NOAA GFS that has that hour | points about 28 km apart (coarser clouds on phones) |
| Earth and night lights | NASA Blue Marble and Black Marble; water from Natural Earth | still images; the sun is placed for the chosen time |
The layers are published as plain image files; how to use them is on Data and attribution.
What Jetbrief does for this
The app turns this map into a forecast along your flight's estimated route and altitudes: Calm, Patches possible or Bumps likely, from take-off to landing. In the air, it shows the same planet with your plane on it, even in airplane mode.
Contains modified ECMWF open data (CC BY 4.0). NOAA GFS is public domain; this is not an official NOAA product. Imagery: NASA. Natural Earth is public domain.
Questions
Is this the forecast for my flight?
No. The map shows the forecast at three fixed heights, the raw material a flight forecast is read from. The app reads it for your actual flight: its route, its altitudes and its times. See how it works.
Why is some of the map hatched?
Hatching marks places where the turbulence forecast has no data. The forecast claims nothing there.
How old are the layers?
The line under the title says how long ago the forecast was updated, and Source details gives the exact model runs. Each of the two weather models runs four times a day, so a new forecast arrives on average every three hours, and the map picks it up within minutes. If the newest one is more than 12 hours old, the line says so.
Can I share a view?
Yes. The address bar follows the camera, the layers and the time, and the share button copies it. A shared link keeps its hour; once that hour is no longer in the forecast, the map shows the nearest one and says so.
Coming to the App Store on 30 November 2026
For iPhone and iPad, iOS 26 or later. No account, no subscription.